This presentation was conducted by Sheffield University Professor of Geoscience Chris Clark.
Extent of the British-Irish Ice Sheet
During the last glacial maximum (LGM), cryospheric systems subsumed the majority of the British Isles. To put the scale into perspective, the volume of ice that covered the British Isles would be enough to raise global sea levels by 2.5 meters.
LGM is agreed to be 21,000 years ago and was a sustained period of relatively low global temperatures, allowing for cryospheric systems and processes to alter the shape of the natural Earth that we know today.
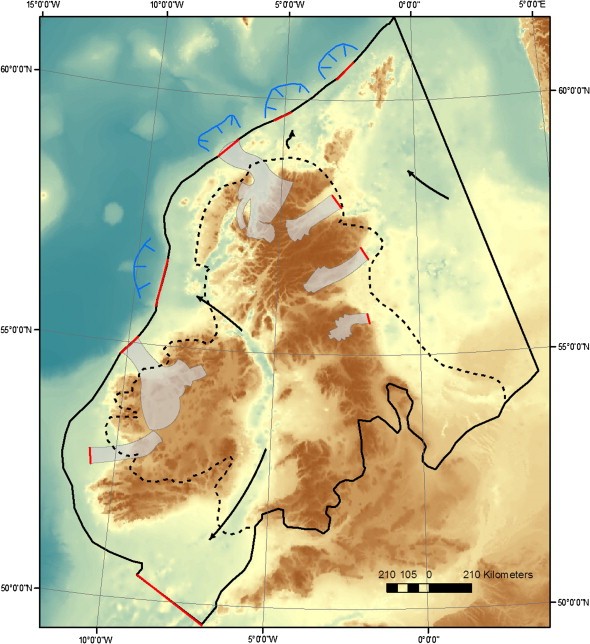
Fig. 1. Two end-member reconstructions of maximum extent of the British-Irish Ice sheet. The smaller (dashed) is the ‘traditional’ view. The larger extent (solid line) includes complete ice cover of Ireland and Scotland and with ice spreading to the continental shelf edge and covering the North Sea.
Chris discussed the many modelling exercises undertaken over the last century that have been used to model the British and Irish Ice Sheet (BIIS). He stated that by nature, historic research has been highly generalised, especially with regard to timings and glacial extent.
Utilising modern methods of technology to map retreat, such as remote sensing data, glacial features were mapped and compiled into a Geographic Information System (GIS).
Particular features of interest included: moraines (terminal and lateral), drumlins, sub-glacial and lateral meltwater channels and eskers.
Research findings suggested that glacial retreat was incomplete in style allowing for disintegration of the BIIS into component ice caps.
It also suggested that retreat was not just subjected to higher ground and that the rate of ice loss was slow at the shelf edge, but a much quicker rate of retreat is evident towards modern shorelines.
Individual Thoughts and Opinions
I found the presentation by Chris particularly thought provoking due to the unfamiliar nature of the topic and engaging style in which the audience’s attention was captured. I enjoyed the visual use in which GIS was used to interpret and enhance raw data allowing for comparisons to be drawn and assumptions to be made.
